
Transnational companies in the XXI centuries global market
Bondo Gasviani
Ph.D. Student of Ivane Javakhishvili Tbilisi State University
bondogasviani@gmail.com
Annotation: Globalization of economy and extension of international economic relations are firstly visible in increasing importance and scale of the activities of transnational companies (TNC). In the modern stage of the development of world economy, TNCs are the main subjects of globalization. Thus, an overview of the latest trends in the world market is important for the formation of a correct strategy for private sector development. The article presents the analysis of the data published by various authoritative international publications and organizations, which demonstrate the limitless possibilities of the global market and the inevitable necessity to operate on it for achieving success.
The trends of TNC development in the XXI century
The volume of TNCs activity is characterized by large scale. Some of them (“General Electric”, Exxon Mobil Corporation”, “General Motors”, “Ford”, “royal Dutch Shell”) own and manage resources, much more than many countries state revenue is and their international “nature” makes them out of any nations juridical influence.
Big part of the world is waiting and looking to authoritative international journals and organization reports regarding the successful international companies that gives opportunity to make some analysis and conclusions from economic as well as social and political point of view. “Fortune” yearly publishes rating named “Global 500”, list with top 500 companies with highest income. Also, in ranking reader can find information about companies, markets they operate in, directions of their work, which gives opportunity to make an interesting observations and conclusions.
According to the article* published in 2014 – “Global business is back. After limping through a worldwide financial crisis and economic slowdown, the 500 largest companies ranked by revenues shattered. all sorts of performance records in 2013: They racked up combined revenues of 31.1 trillion USD, up to 2.5% from 2012, and profits soared 27%, to nearly 2 trillion USD”.
Analysis of the existing data in the rankings for the 2012-2018 provides us to make the following conclusions: In 2014 the world’s 500 largest companies generated 31.2 trillion USD in revenues that is slightly higher than in 2013, but the profit has decreased by 15% to $ 1.7 trillion USD. In 2015 and 2016, the data has changed significantly, the total revenue decreased by 11% and reached 27.7 trillion dollars, while profit has decreased by 25% and became 1.5 trillion. In fact, income and profits have fallen below to the data on the world financial crisis (income decreased by 9%, profit by 4.5%). Despite the fact that the total income and profit in 2017 increased compared to the previous year, it could not overcome the indicators for 2013 (Diagram N1). Thus, in the 2014 article optimistic expectations were not realized. Depending on that, bringing the slight growth of revenues as an argument to mention that global business is back and the economic crisis has been overcome was an early conclusion.
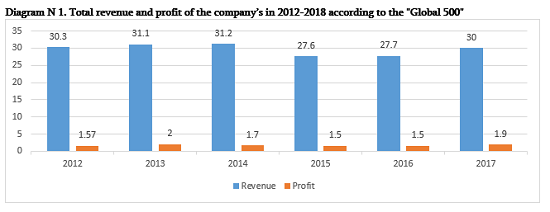
Surce: http://fortune.com/global500/
Since 2001, there has been a significant change in the geographical distribution of the companies in the Global 500 rankings. The number of North American companies in 2011 were 215, Asian companies were – 116 and the share of companies that was based on the territory of Europe were 158**. According to the data of 2018, the number of North American companies has decreased by 34% to 142 compared with 2001. European companies were more or less stable, but in this case there was a slight decrease of 11% to 141. Comparing to American and European companies in 2001-2018 years, the number of Asian companies has sharply increased to 203, which is 75% more than in 2001 (Diagram N2). Those great rate of progress was caused by the growth of Chinese, Indian and South Korean origin companies and production capacity of geographic chaining in it that is precondition of stable business environment and cheap labor.
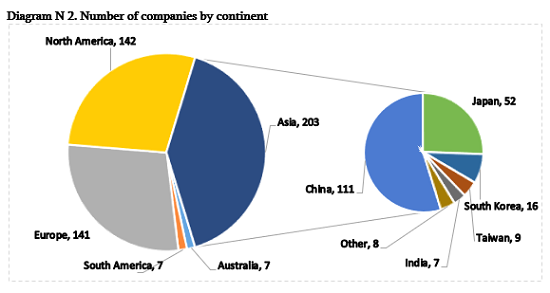
Surce: https://www.forbes.com/global2000/list/
The Forbes Global 2000 is an annual ranking of the top 2,000 public companies in the world by Forbes magazine. The ranking is based on a mix of four metrics: sales, profit, assets and market value. The list has been published since 2003. In discrepancy to the Global 500, Forbes Global 2000, with additional data and available quantity of the companies gives more than 4 times, opportunity to conduct a more quantitative and scalable analysis. Sorting the rating according to different indicators gives different table and information. For example, by the data of 2018, the “Walmart” occupies the top spot with a total sales of 500.3 billion USD, while the “Apple” is in the 8th place with revenue 247.5 of bilion USD, What is less than 49% of “Walmart” revenue. However, “Apple’s” net profit was 53.3 billion USD which is 5.4 times higher than the “Walmart’s” profit. Also, “Apple’s” market value is 926.9 billion USD, which is in 680.7 billion USD more than “Walmart’s” market value. Thus, a high volume of annual revenue and sales cannot be an indicator of success for the company. Although the analysis of the „Global 500“ and „Forbes Global 2000“ data provides an opportunity to assess the competition and current trends in the global market, it is impossible to determine the real level of transnationalization of the company and identify how the company is dependent on the global market.
Special interest attracts criteria for the transnationalization of companies Developed by the United Nations Conference on Trade and Development (UNCTAD) – Transnationality Index (TNI). The Transnationality Index (TNI) is a means of ranking multinational corporations that is employed by economists and politicians. It is calculated as the arithmetic mean of the following three ratios (where “foreign” means outside of the corporation’s home country***):
• the ratio of foreign assets to total assets;
• the ratio of foreign sales to total sales;
• the ratio of foreign employment to total employment;
We can represent in as following formula:

Where:
Ti – Level of Transnationalization;
A1 – Assets outside the home country;
A – Total Assets;
R1 – Goods/Services sold outside the home country;
R – Total Goods/Services sold;
S1 – Quantity of Employees outside the home country;
S – Total quantity of the Employees.
TNCs are also ranked by the amount of foreign assets that they own. However, the TNI ranking can differ markedly from this. For example, as of 2017, “Royal Dutch Shell plc” was the first largest TNC in terms of 349 billion USD foreign asset ownership. However, it ranked only 34 st by the TNI, with an index of only 74.3%. Opposite to the asset sorting, by the TNI „Rio Tinto PLC“ 99.3% is the first company in the ranking, but by the owning of the international assets, it is in 30 th place.
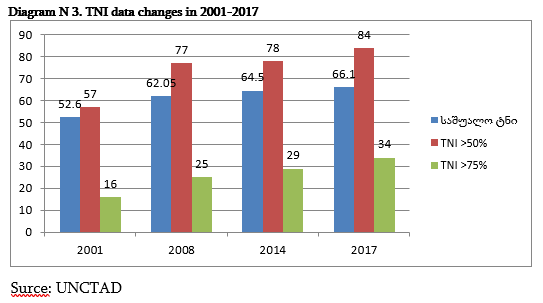
Peter Dicken, professor of the School of Environment and Development at the University of Manchester, whos scientific work is related to the study of globalization issues argues that TNI data refute the assertions of hyperglobalism. He thought that TNIs data opposed to the opinion, that multinational corporations are “inexorably, and inevitably, abandoning their ties to their country of origin”. If that were the case, we would expect the largest multinational corporations to have the majority of their assets, sales, and employment outside of their countries of origin, and thus the majority of those corporations to have high TNIs. In fact, in the UNCTAD TNI data for the top 100 multinational corporations for 2001, the mean TNI was 52.6%, 57 of the 100 companies have a TNI greater than 50%, and only 16 have a TNI greater than 75%. Thus, he concludes, measured TNI data provide little evidence for multinational corporations having the proportions of their assets, sales, and employees outside of their home countries that one would expect for truly global firms****.
According to analysis of the UNCTAD data published at 2001-2014, about 100 leading nonfinancial corporations, shows that the interest of companies in the world market has steadily increased. By 2017, the average number of the trans-nationalization is 66.1% (13.5% more than at 2001), 84 from 100 companies have more than 50% of the trans-nationalization (27 companies more than at 2001) and 34 from 100 have more than 75% of the trans-nationalization (18 more than at 2001) (Diagram N1).
In addition to the information mentioned above, we need to notice another important data from UNCTAD about top 100 TNCs: 62% of all assets, 64% of the sale and 67% of the employees are outside the home countries, that strengthens the opinion about the increasing power of the internationalization and globalization. From today’s perspective, we can truly say that TNCs are losing connection with home countries and are becoming depended on the global market.
Conclusion. Changes in the global market in the XXI century greatly increased the role of TNCs in the global economy. All of the above demonstrates that there is a total internationalization of production and geographical relocation of production facilities from developed economies to developing and transition economics countries. Thus, the economic development of any country is to encourage more active participation of business entrepreneurs in the global market. Consequently, both the public and private sectors in Georgia should take advantage of geographical advantages, attract investors and support new initiatives (start-ups) that are aimed at creating consumer goods and services for the global market.
* Stephanie N. Mehta – GLOBAL 500 2014, http://fortune.com/global500/2014/
** “A New Perspective on the Corporate World”. CNN Money, Fortune Magazine. Retrieved 8 July 2013.
*** “A New Perspective on the Corporate World”. CNN Money, Fortune Magazine. Retrieved 8 July 2013.
**** Peter Dicken Global Shift. SAGE. (2003). pp. 221–224
References:
1. Shengelia T. – “Global Business”, “New Georgia”, Tbilisi 2010;
2. Jamagidze L. – “The Role of Transnational Corporations in the Globalization of the World Economy”, Universal, Tbilisi, 2010;
3. Kasradze T. – “Transnationalization – the driving force of the world economic development”, Journal Georgian Economy, 2009;
4. UNCTAD – „World Investment Report“, Geneva, 2016, 2018;
5. Stephanie N. Mehta – GLOBAL 500 2014. http://fortune.com/global500/wal-mart-stores-1/;
6. “A New Perspective on the Corporate World”. CNN Money, Fortune Magazine. Retrieved 8 July 2013;
7. Stuart Wall and Bronwen Rees – International Business. Pearson Education. 2004;
8. Peter Dicken Global Shift. SAGE. (2003);
9. Shengelia T., Berishvili Kh. (2014). The Role of Institutional Reforms in the Improvement of the Georgian Investment Environment. Journal of Social Sciences, Volume 3, Issue 2, International Institute of Social and Economic Sciences;
10. Shengelia T. (2014) Tendencies of The Capital International Movement and Its Influence on the Economy of the Sovereign State. Georgian International Journal of Scince, Tecnology and Medicine, Volume 6, Issue 1, Number 4, Nova Science Publishers, Inc.;
11. Shengelia T., Berishvili Kh. (2014). Evaluation of the Global Position of Georgia and its Role In the Development of Business. Georgian International Journal of Scince, Tecnology and Medicine, Volume 6, Issue 1, Nova Science Publishers, Inc.