

High-Frequency Trading
Tamta Beroshvili
Student
tamtaa.beroshvili@gmail.com
Resume: Quite often, by the term “algorithm” participant of the financial market are described. The algorithms can be incredibly diverse and aim at many different types of activities such as fast profits, diversification of the shares or attempting to confuse other algorithms. In this article, there will be an overview of high-frequency trading data and methods for analyzing these data in order to study high-frequency trading. It will also include approaches to identifying high-frequency participants in trade.
რეზიუმე: ფინანსური ბაზრების ერთ-ერთი მონაწილის აღსაწერად, ბოლო დროს, ხშირად გამოიყენება ტერმინი „ალგორითმი“. აღნიშნული ალგორითმები შესაძლოა იყოს საოცრად მრავალფეროვანი და მიმართული სხვადასხვა მიზნისკენ, როგორიცაა: მოგების სწრაფი მიღება, აქტივების დივერსიფიკაცია ან სხვა ალგორითმების „დაბნევა“. მოცემულ სტატიაში განხილული იქნება მონაცემები მაღალი სიხშირის კომერციის შესახებ და მეთოდები რომლებითაც ამ მონაცემების ანალიზი არის შესაძლებელი, რათა უკეთ იქნეს შესწავლილი ეს ფენომენი. სტატია ასევე მოიცავს მიდგომებს, რომელთა დახმარებითაც ხდება ვაჭრობისას მაღალი სიხშირის კომერციის მონაწილეების აღმოჩენა.
Introduction
One of the most significant changes in the structure of the financial market over the past few years is the development of high-frequency trading (HFT). According to expert estimates, high-frequency trading is responsible for most of the financial market transactions (for example, more than 77% of transactions in the UK market according to Tabb Group) and is able to critically affect the occurrence of systemic instabilities: for example, the loss of capitalization of stock indices during the so-called “Flash Crash” on May 6, 2010 amounted to about 1 trillion in less than 10 minutes.
The very term “high-frequency trading” is quite new and has no clear definition. Many researchers and regulators of the financial market define it in various ways, but there are common features that allow us to talk about high-frequency trading as a separate phenomenon. Issues related to approaches to the definition of high-frequency trading and the identification of participants using this type of trade in their activities are becoming increasingly relevant for modern markets. Identification implies the establishment of the identity of an unknown market participant to a known group of agents using a certain type of trade. The task of identification is closely related to the task of classifying – the division of all market participants into specific groups.
1. Approaches to the definition of high-frequency trading
1.1. Definitions of regulatory bodies.
One of the first definitions of high-frequency trading is the definition given by the United States Securities and Exchange Commission (SEC) in 2010 (SEC, 2010). The US Securities and Exchange Commission argues that the term “high-frequency trading” is used to refer to professional market participants who trade at their own expense and use strategies that generate a large number of transactions on a daily basis. These participants can be organized in various ways, including private trading companies, hedge funds and other organizational forms (which are commonly referred to as “private firms”). There are also quite a few definitions of financial regulators that, when defining HFT, describe various aspects of their activities. In particular, similar definitions were given by: The Securities and Exchange Commission (SEC); Commodity Futures Trading Commission (CFTC); The International Organization of Securities Commissions (IOSCO); The Australian Securities and Investment Commission (ASIC); The European Union Directive on the Markets of Financial Instruments (MiFID), which is the main document regulating financial markets in the European Union. In all definitions of these regulators, there are several basic characteristics that are inherent for high-frequency traders:
1. Complex high-speed programs – To increase the speed of decision-making, high-frequency traders use sophisticated expensive equipment that allow tracking and analysis of large amounts of information to make investment decisions based on the identified patterns in real time. For this purpose, in particular, specialized hardware such as field programmable gate arrays (FPGAs), graphic accelerators (GPUs), etc. are used. The high complexity of the algorithms and the required speed of operation practically exclude the participation of a person from the decision-making process.
2. Minimization of delay time (latency) – There is a direct correlation between the efficiency of trading algorithms and the time of transfer of orders from the algorithm to the core of the exchange. Companies that are engaged in high-frequency trading invest a significant part of their funds in technology to reduce such a delay. For example, trade organizers offer expensive server hosting services on the exchange in the immediate vicinity of the payroll (this service is commonly called “collocation”).
3. Generating significant number of messages during the day – High-frequency trading, as a rule, is characterized by a high number of messages (exhibits, changes, withdrawals and transactions), high trading turnover during the trading day, a high ratio of the number of bids submitted to the number of executed transactions and the relatively short average life of the application. In practice, high-frequency algorithms can generate thousands of applications per second, which are either executed or taken off.
4. Close to zero position at the end of the trading day – The retention position, used by the high-frequency traders is usually from milliseconds to hours. At the same time, such participants prefer not to leave an unclosed or unhedged position for the night after the auction to avoid market risk.
5. Private firms that sell their own funds – The specificity of high-frequency trade does not require large initial capital and attraction of borrowed funds of large institutional investors, which leads to the fact that HFT firms trade at their own expense.
In addition, there are many definitions of high-frequency participants in academia (Chlistalla, 2011; Fabozzi, 2011), who have recently been increasingly studying the behavior, influence and various aspects of HFT. In all these definitions, there are common features that characterize high-frequency participants as fast algorithms that create a significant number of applications and transactions with a short hold-over period.
1.2. Classifications used by trade organizers.
Most research on high-frequency systems uses transactional information on the flow of applications with pre-defined classes of agents provided by trade organizers. Thus, the NASDAQ OMX provides researchers with access to transactional data that contains the classification of participants into the following categories:
• HFT participants providing a liquidity offer
• HFT participants demanding liquidity
• Non-HFT participants providing a liquidity offer
• Non-HFT participants demanding liquidity
The classification is based on NASDAQ OMX’s internal information about the use of server placement services near the core of the exchange and analysis of the trading behavior of algorithms. This approach does not allow to uniquely identify all HFT participants in the market. This is because of the fact that there are large brokerage companies (Goldman Sachs, JPMorganChase, etc.) providing services to connect to the company’s servers, located on the exchange, for their customers. These companies have recently been aggressively hiring some of the best programmers in the world in order to make sure that they are able to compete with other HFT traders successfully. Nevertheless, 26 HFT firms identified by NASDAQ OMX are the best approximation of the HFT group. These participants trade as independent private firms (Brogaard, 2011; Brogaard, et al., 2014; Zhang, 2013)
A similar database, called SABRE, is provided by the UK Financial Regulation and Supervision Authority (FSA) and contains transactional information about transaction prices, their volumes, time and the identifiers of the participants in the transaction. It also identifies the buyers and sellers, and allows you to uniquely identify the initiator of each transaction. The SABRE database covers the trading activity of all participants regulated by the FSA, and includes transactions of the largest HFTs. Knowledge of agents in transactions allows unique identification of the companies or the individuals to whom the transaction was executed. In order to allocate HFT participants to markets, the UK Financial Regulation and Supervision Authority uses articles, reporting, press, official documents, a description of activities on the site and other public information. Subsequently, in the event that the company claims to use high-frequency algorithms, low latency algorithms or electronic market-making, the researchers identify such a firm as HFT.
Another example of a predefined type of agent is contained in data from electronic trading platforms EBS (Electronic Broking Services) and Xetra (Exchange Electronic Trading), which divide all participants into agents using algorithms and not using any such programs in their trade (Hendershott, Riordan, 2013). In the EBS market research, the authors use data with a minute frequency. This data contains the following information: Value of the transaction, Direction, Flag, algorithm – a person who informs about the counterparty in the transaction, A flag informing about the initiator of the transaction. At the Xetra exchange, the algorithms are identified using information about commissions. In December 2006 Deutsche Borse – one of the largest exchange organizations – presented its program of commission remuneration for algorithmic market participants. Agents using this program were labeled as algorithmic participants. A study based on this data analyzes the algorithmic participants, which are some approximation of the HFT.
2. Approaches to the Identification of High-frequency Traders
2.1. The Kirilenko-Kyle Approach
The most recent famous work describing the classification of participants in the financial market, including the allocation of HFT participants, is the work of A. Kirilenko, P. Kyle and others (2017). The study analyzes data on E-mini-futures contracts for the S&P 500 index traded on the Chicago Mercantile Exchange. For the classification of participants in the financial market, the following characteristics were used:
• Net position in the papers at the end of the day
• The degree of volatility of the position in the papers for the analyzed day
• The total volume of purchased and sold securities for the analyzed day
At the first stage of the classification, the authors divided large and small market participants depending on the volume of trades (9 or more contracts). Large participants were further divided into fundamental participants and intermediaries in the market. If the participant’s net position on securities exceeded 15% of its total turnover in the market, then such a participant would be classified as a fundamental buyer/seller, depending on the direction of its position change.
In order to identify intermediary algorithms in the market, they used the criteria for the volatility of the position and the balance of the position at the end of the day. If the position in the papers at the end of the day did not exceed 5% of the participant’s trading turnover for the day and the position fluctuated within 1.5% of the closing level of the position at the end of the day, such participant was considered to be an intermediary. 7% of the most active intermediaries on the market were identified as high-frequency algorithms. The remaining participants were attributed to opportunistic participants. Subsequently, this classification was used for agent modeling of the financial market (Yang, et al., 2012). This approach has become the best starting point for further research in the field of classification of participants in the financial market. In the other articles, the authors used this approach and improved the quality of highlighting high-frequency market participants on the trading data by E-mini contracts in August 2010. In their approach, four criteria appeared for HFT participants to be able to satisfy:
• The participant’s trading turnover for the day must exceed 10,000 contracts
• The position at the end of the day should not exceed 2% of the total volume of trade turnover per day
• The maximum volatility of the participant’s relative position should not exceed 15%
• The participant should be marked as HFT for more than 50% of active days, and the number of active days in the total sample should be at least 50%
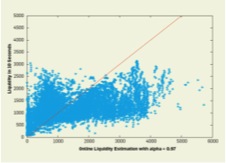
Fig. 1. 5000 Online Liquidity Estimation with alpha 0.97 (Loveless, et al., 2013)
The proposed approach has undeniable advantages that take into account the actual trading behavior of participants, but it should be noted that with this classification method, the speed of participants and the number of messages (statements, changes, withdrawals of applications) generated by high-frequency participants are lost from attention.
2.2. The IIROC approach
The Canadian Regulator of the financial market (The Investment Industry Regulatory Organization of Canada, IIROC) in 2012 published a report (IIROC, 2012), which analyzed a group of participants with a high proportion of applications compared to the number of transactions. This group is positioned as an initial approximation for a group of high-frequency market participants. Using the ratio of the number of applications to the number of transactions, the distribution of this characteristic across all market participants was constructed. The group of participants in the ITU included all agents who had a ratio of the number of applications to the number of transactions greater than 11.2: 1.
The main disadvantage of this approach to identifying high-frequency participants is that it does not have a threshold value for the number of applications, and thus (a) it does not exclude participants with low trading activity (for example, less than 100 applications per day), (b) it excludes participants with high trading activity (for example, more than 1 million applications per month), but with a low ratio of the number of applications to the number of transactions.
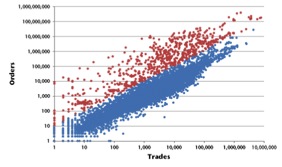
Fig. 2. The results of the application of the IIROC approach (2012) to the classification of market participants, based on the ratio of the number of applications to the number of transactions (order-to-trade)
2.3. The ASIC approach.
A recent study (ASIC, 2013) of the Australian Securities and Investments Commission (ASIC) in 2013 identified the indicators that are used by the regulator to isolate the HFT groups:
• The ratio of the number of applications to the number of transactions
• Position at the end of the day relative to the total turnover of trades
• The total turnover of trades per day, which is calculated as the sum of bought and sold securities denominated in money
• The number of fast applications, calculated as the absolute number of applications that have successfully arrived at a time interval of 40 milliseconds
• The holding time of the position, which is calculated as the weighted average volume of the holding time of the position
• The indicator of the presence at the best quotation, calculated as the ratio of the bids for the best quotation to the total number of applications
Each participant in the market was ordered for each of the six indicators. The points were calculated depending on the quartile in which the participant was involved in each of the characteristics. So, for example, the hit in the top quartile (quartile level 0.75) was associated with 4 points, and falling into the lower quartile (quartile level 0.25) was associated with 1 point. The final rating was calculated by adding the scored points for each of the six indicators. The rating score was in the range of 6 to 24 points. This final index showed how much each agent is similar to a high-frequency participant. In order to identify the HFT, all agents were ranked by their final rating and 15% of agents with the highest ratings were taken. Such participants were classified as high-frequency.
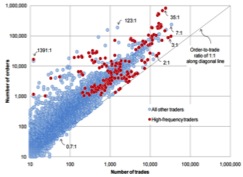
Fig. 3. Results of applying the ASIC approach (2013) to the classification of market participants (high-frequency traders are highlighted in red).
Conclusion
This article presented the main definitions of the concept of “high-frequency trading” – one of the newest phenomenon that determines the structure of the modern financial market. Approaches to the identification of HFT are identified. Most studies on HFT use ready-made classifications provided by trade organizers, while the identification of high-frequency market participants is devoted to a relatively small number of empirical works – the article briefly presents the main ones. The presented approaches have a number of significant drawbacks, which requires the development of more advanced methods for identifying HTT.
Meanwhile, it would be advised for the Georgian lawmakers to construct code with regards to HFT and the extent to which it can be utilized in the country. It is highly likely to arrive on Georgian markets very soon, and it would be unwise to be unprepared for such an event. As an example, Italian government has already put a direct tax on HFT as a precaution for the flash crashes and other types of chaos it is capable of producing (Reuters, 2013). Given the relatively small size of the Georgian economy as well as the market capitalization of the companies on its stock exchanges, HFT could have devastating effects. Therefore, one of the above mentioned definitions should be approved and certain limitations put on it.
References
Australian Securities and Investments Commission (ASIC). (2013), Report 331: Dark liquidity and high-frequency trading.
Brogaard J. (2011), High frequency trading and volatility – Available at: http://www.managedfunds. org/industry-resources/industry-research/high-frequency-trading-and-volatility/
Brogaard J., Hendershott T., Riordan R. (2014) High frequency trading and price discovery. Available at: https://www.ecb.europa.eu/pub/pdf/scpwps/ecbwpl 602.pdf
Chlistalla M. (2011), High-frequency trading. Better than its reputation? Report, Deutche Bank Research.
Fabozzi F.J., Focardi S.M. Jonas C. (2011), High-frequency trading: methodologies and market impact Reviews of Futures Markets, The Institute for Financial Markets.
Hendershott T. Riordan, R. (2013), Algorithmic Trading and the Market for Liquidity, Journal of Financial and Quantitative Analysis, 48, (04).
Investment Industry Regulatory Organization of Canada (IIROC), (2012), The HOT Study Phases I and II of IIROC’s Study of High Frequency Trading Activity on Canadian Equity Marketplaces.
Kirilenko, A.A. Kyle, A.S. Samadi, M. Tuzun, T. (2017), The Flash Crash: High-Frequency Trading in an Electronic Market (January 6, 2017). Journal of Finance, Forthcoming – Available at: https://ssrn.com/abstract=1686004 or http://dx.doi.org/10.2139/ssrn.1686004
Loveless, J. Stoikov, S. Waeber R. (2013), Online Algorithms in High-Frequency Trading, Communications of the ACM, Vol. 56 No. 10, Pages 50-56 – Available at: 10.1145/2507771.2507780
Reuters (2013). Italy first to slap tax on high speed stock trading. Deutsche Welle – Available at: http://www.dw.de/italy-first-to-slap-tax-on-high-speed-stock-trading/a-17060424
Yang, S.Y. Qiao, Q. Beling, P. Scherer, W.T. Kirilenko, A.A. (2012), Gaussian Process Based Trading Strategy Identification. – Available at: https://ssrn.com/abstract=2051138
Zhang S.S. (2012), Need for Speed: An Empirical Analysis of Hard and Soft Information in a High Frequency World. – Available at: http://ssrn.com/abstract=1985951